
티스토리 뷰
[1]파일을 data를 읽어 value를 추가하는 chart
using System;
using System.Collections.Generic;
using System.ComponentModel;
using System.Data;
using System.Drawing;
using System.IO;
using System.Linq;
using System.Text;
using System.Threading.Tasks;
using System.Windows.Forms;
using System.Windows.Forms.DataVisualization.Charting;
namespace _038_EcgPpt
{
public partial class Form1 : Form
{
private double[] ecg = new double[100000];
private double[] ppg = new double[100000];
private int ecgCount; // ecg 데이터 갯수
private int ppgCount; // ppg 데이터 갯수
private Timer t = new Timer();
public Form1()
{
InitializeComponent();
this.Text = "ECG/PPG";
this.WindowState = FormWindowState.Maximized;
EcgRead();
PpgRead();
ChartSetting();
t.Interval = 10; // 0.01초
t.Tick += T_Tick;
}
int cursorX = 0; // 디스플레이되는 데이터의 시작점
bool scrolling = false; // true 일 때 스크롤
private void T_Tick(object sender, EventArgs e)
{
// 한 화면에 500개의 데이터를 보여줄 예정
if (cursorX + dataCount < ecgCount)
ch.ChartAreas[0].AxisX.ScaleView.Zoom(
cursorX, cursorX + dataCount);
else
t.Stop();
cursorX += 2;
}
private void ChartSetting()
{
// 커서 사용 가능
ch.ChartAreas[0].CursorX.IsUserEnabled = true;
// zoom 범위 선택 가능
ch.ChartAreas[0].CursorX.IsUserSelectionEnabled
= true;
// chart 영역 설정
ch.ChartAreas[0].BackColor = Color.Black;
ch.ChartAreas[0].AxisX.Minimum = 0;
ch.ChartAreas[0].AxisX.Maximum = ecgCount;
ch.ChartAreas[0].AxisX.Interval = 50;
ch.ChartAreas[0].AxisX.MajorGrid.LineColor =
Color.Gray;
ch.ChartAreas[0].AxisX.MajorGrid.LineDashStyle =
ChartDashStyle.Dash;
ch.ChartAreas[0].AxisY.Minimum = -2;
ch.ChartAreas[0].AxisY.Maximum = 6;
ch.ChartAreas[0].AxisY.Interval = 0.5;
ch.ChartAreas[0].AxisY.MajorGrid.LineColor =
Color.Gray;
ch.ChartAreas[0].AxisY.MajorGrid.LineDashStyle =
ChartDashStyle.Dash;
// Series 2개 새로 만들기
ch.Series.Clear();
ch.Series.Add("ECG");
ch.Series.Add("PPG");
ch.Series["ECG"].ChartType = SeriesChartType.Line;
// ch.Series[0].ChartType = SeriesChartType.Line;
ch.Series["ECG"].Color = Color.Orange;
ch.Series["ECG"].BorderWidth = 2;
ch.Series["ECG"].LegendText = "ECG";
ch.Series["PPG"].ChartType = SeriesChartType.Line;
// ch.Series[1].ChartType = SeriesChartType.Line;
ch.Series["PPG"].Color = Color.LightGreen;
ch.Series["PPG"].BorderWidth = 2;
ch.Series["PPG"].LegendText = "PPG";
// 데이터를 series에 추가
foreach(var v in ecg)
{
ch.Series["ECG"].Points.Add(v);
}
foreach (var v in ppg)
{
ch.Series["PPG"].Points.Add(v);
}
}
private void PpgRead()
{
string fileName = "../../Data/ppg.txt";
string[] lines = File.ReadAllLines(fileName);
double min = double.MaxValue;
double max = double.MinValue;
int i = 0;
foreach (var line in lines)
{
ppg[i] = double.Parse(line);
if (ppg[i] < min) min = ppg[i];
if (ppg[i] > max) max = ppg[i];
i++;
}
ppgCount = i;
string s = string.Format(
"PPG: Count={0}, min={1}, max={2}",
ppgCount, min, max);
MessageBox.Show(s);
}
private void EcgRead()
{
string fileName = "../../Data/ecg.txt";
string[] lines = File.ReadAllLines(fileName);
double min = double.MaxValue;
double max = double.MinValue;
int i = 0;
foreach(var line in lines)
{
ecg[i] = double.Parse(line) + 3;
if(ecg[i] < min) min = ecg[i];
if(ecg[i] > max) max = ecg[i];
i++;
}
ecgCount = i;
string s = string.Format(
"ECG: Count={0}, min={1}, max={2}",
ecgCount, min, max);
MessageBox.Show(s);
}
private void autoScrollToolStripMenuItem_Click(object sender, EventArgs e)
{
t.Start();
scrolling = true;
}
private void viewAllToolStripMenuItem_Click(object sender, EventArgs e)
{
ch.ChartAreas[0].AxisX.ScaleView.Zoom(0, ecgCount);
t.Stop();
scrolling = false;
}
private void exitToolStripMenuItem_Click(object sender, EventArgs e)
{
this.Close();
}
bool isTimerRunning = true;
private int dataCount = 500;
private void ch_Click(object sender, EventArgs e)
{
if(isTimerRunning)
{
t.Stop();
isTimerRunning = false;
}
else
{
t.Start();
isTimerRunning = true;
}
}
private void ch_MouseClick(object sender, MouseEventArgs e)
{
HitTestResult htr = ch.HitTest(e.X, e.Y);
if(htr.ChartElementType == ChartElementType.DataPoint)
{
t.Stop();
string s = string.Format(
"Count: {0}, ECG: {1}, PPG:{2}",
htr.PointIndex,
ch.Series["ECG"].Points[htr.PointIndex].YValues[0],
ch.Series["PPG"].Points[htr.PointIndex].YValues[0]);
MessageBox.Show(s);
}
}
private void dataCountToolStripMenuItem_Click(object sender, EventArgs e)
{
dataCount = dataCount*2;
}
private void dataCountToolStripMenuItem1_Click(object sender, EventArgs e)
{
dataCount = dataCount / 2;
}
}
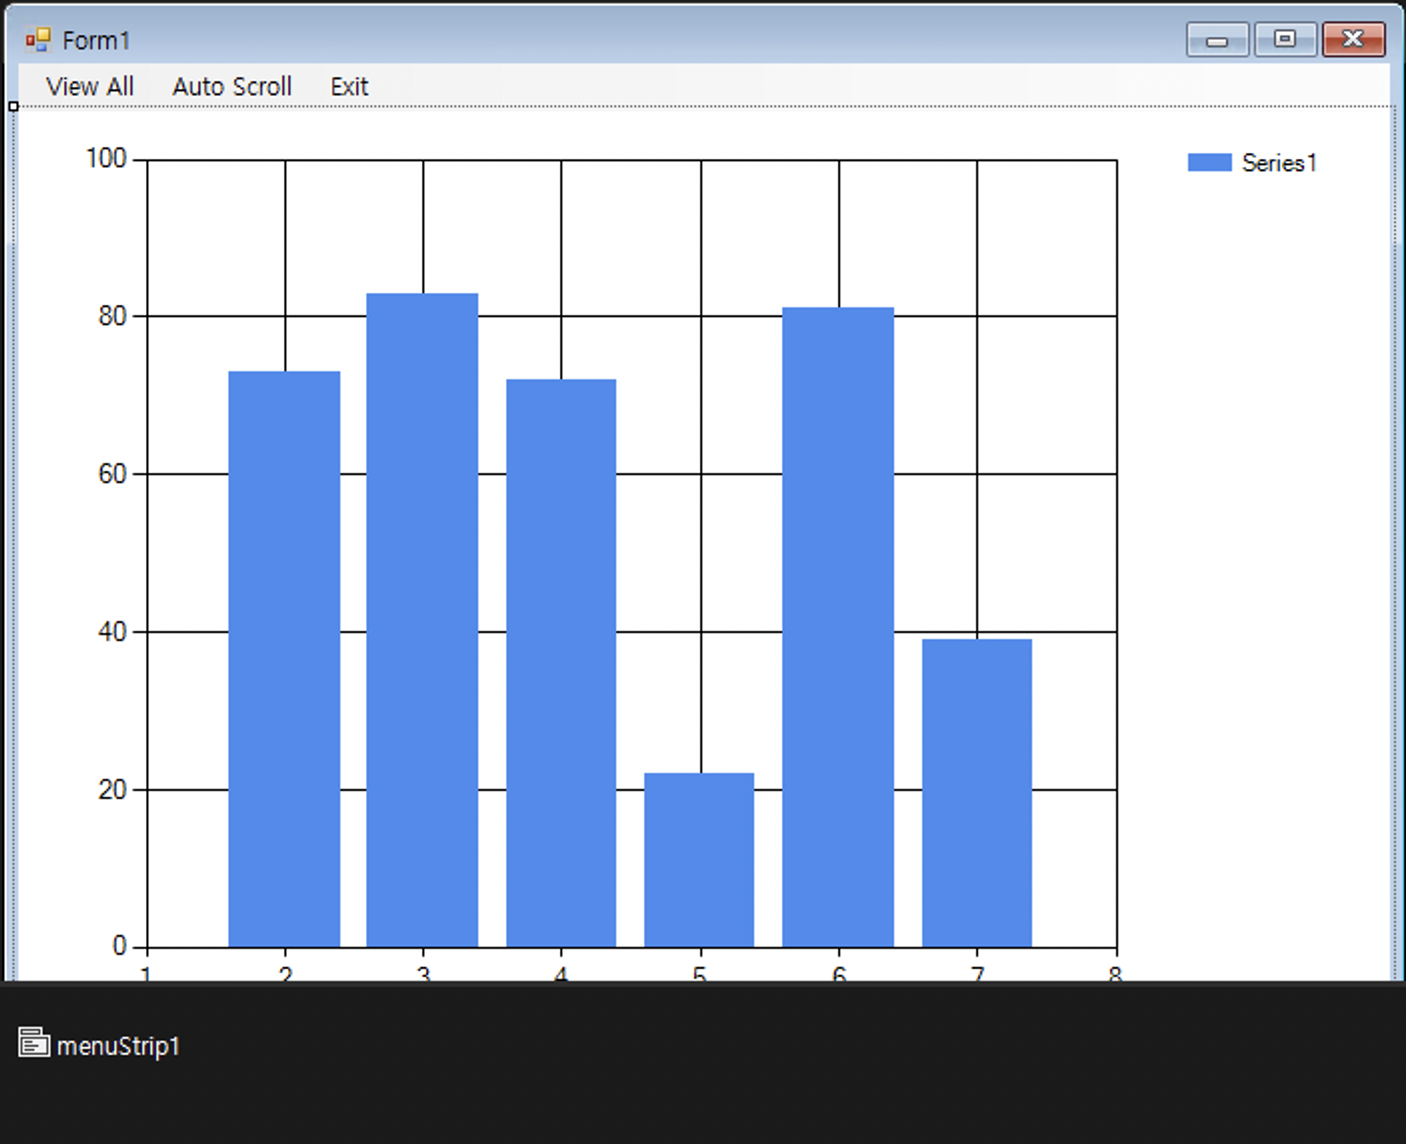
}디자인에는 chart와 menustrip하나를 추가하여 menu를 세 개 생성해주었다. (view all , autoscript , exit)
private double[] ecg = new double[100000];
    private double[] ppg = new double[100000];
    private int ecgCount; // ecg 데이터 갯수
    private int ppgCount; // ppg 데이터 갯수
    private Timer t = new Timer();
폼 클래스에는 ecg , ppg 배열과
count를 세어 줄 ecgCount , ppgCount를 int형으로
timer t 를 생성 해주었다.
-0.478638
-0.490662
-0.502319
-0.503479
-0.491028
-0.458252
-0.394165
-0.304688
-0.199036
-0.0756836
0.00457764
0.0317383
0.0540161
0.067749
0.0787354
0.0976563
0.0933838
0.0857544
0.093689
0.108337값이 너무 많아 10개만 뽑아온 위에서부터 ppg와 ecg파일이다.
이 파일들을 읽는 함수를 만들어 보았다.
private void PpgRead()
    {
      string fileName = "../../Data/ppg.txt";
      string[] lines = File.ReadAllLines(fileName);

      double min = double.MaxValue;
      double max = double.MinValue;

      int i = 0;
      foreach (var line in lines)
      {
        ppg[i] = double.Parse(line);
        if (ppg[i] < min) min = ppg[i];
        if (ppg[i] > max) max = ppg[i];
        i++;
      }
      ppgCount = i;
      string s = string.Format(
        "PPG: Count={0}, min={1}, max={2}",
        ppgCount, min, max);
      MessageBox.Show(s);
    }
ppg를 읽는 함수부터 만들어보았다.
filename에 "../"는 상위폴더로 이동하라는 명령어이다.
string타입 배열 lines를 선언하여 ppg로부터 한줄씩 읽어 값을 저장해준다.
double min을 maxvalue로 max를 minvalue로 설정한다 (흔히 최대최소값 찾을때 사용하는 방법이다.)
int형 i를 선언하고
for문을 line의 원소인 lines를 전부 훑는식으로 돌려 ppg배열에 double로 parse하여 저장해주고
ppg[i]값을 기준으로 최대값과 최소값을 계속하여 탐색해준다.
그리고 i++로 몇줄이 있는지count해준다.
값이 전부 추가되면 count와 min , max를 포매팅한 string s를 내용으로 한 messageBox를 띄워준다.
private void EcgRead()
    {
      string fileName = "../../Data/ecg.txt";
      string[] lines = File.ReadAllLines(fileName);

      double min = double.MaxValue;
      double max = double.MinValue;

      int i = 0;
      foreach(var line in lines)
      {
        ecg[i] = double.Parse(line) + 3;
        if(ecg[i] < min) min = ecg[i];
        if(ecg[i] > max) max = ecg[i];
        i++;
      }
      ecgCount = i;
      string s = string.Format(
        "ECG: Count={0}, min={1}, max={2}",
        ecgCount, min, max);
      MessageBox.Show(s);
    }
내용만 ecg로 바꿔 똑같이 실행해주고 메세지박스를 띄워준다.
(내용이 너무 길어질 것 같아 생략하였습니다.)
private void ChartSetting()
    {
      // 커서 사용 가능
      ch.ChartAreas[0].CursorX.IsUserEnabled = true;
      // zoom 범위 선택 가능
      ch.ChartAreas[0].CursorX.IsUserSelectionEnabled
        = true;

      // chart 영역 설정
      ch.ChartAreas[0].BackColor = Color.Black;
      ch.ChartAreas[0].AxisX.Minimum = 0;
      ch.ChartAreas[0].AxisX.Maximum = ecgCount;
      ch.ChartAreas[0].AxisX.Interval = 50;
      ch.ChartAreas[0].AxisX.MajorGrid.LineColor =
        Color.Gray;
      ch.ChartAreas[0].AxisX.MajorGrid.LineDashStyle =
        ChartDashStyle.Dash;

      ch.ChartAreas[0].AxisY.Minimum = -2;
      ch.ChartAreas[0].AxisY.Maximum = 6;
      ch.ChartAreas[0].AxisY.Interval = 0.5;
      ch.ChartAreas[0].AxisY.MajorGrid.LineColor =
        Color.Gray;
      ch.ChartAreas[0].AxisY.MajorGrid.LineDashStyle =
        ChartDashStyle.Dash;

      // Series 2개 새로 만들기
      ch.Series.Clear();
      ch.Series.Add("ECG");
      ch.Series.Add("PPG");

      ch.Series["ECG"].ChartType = SeriesChartType.Line;
      // ch.Series[0].ChartType = SeriesChartType.Line;
      ch.Series["ECG"].Color = Color.Orange;
      ch.Series["ECG"].BorderWidth = 2;
      ch.Series["ECG"].LegendText = "ECG";

      ch.Series["PPG"].ChartType = SeriesChartType.Line;
      // ch.Series[1].ChartType = SeriesChartType.Line;
      ch.Series["PPG"].Color = Color.LightGreen;
      ch.Series["PPG"].BorderWidth = 2;
      ch.Series["PPG"].LegendText = "PPG";

      // 데이터를 series에 추가
      foreach(var v in ecg)
      {
        ch.Series["ECG"].Points.Add(v);
      }
      foreach (var v in ppg)
      {
        ch.Series["PPG"].Points.Add(v);
      }
    }
다음은 차트를 설정해주는 함수를 작성해보았다.
ch.ChartAreas[0].BackColor = Color.Black;
      ch.ChartAreas[0].AxisX.Minimum = 0;
      ch.ChartAreas[0].AxisX.Maximum = ecgCount;
      ch.ChartAreas[0].AxisX.Interval = 50;
      ch.ChartAreas[0].AxisX.MajorGrid.LineColor =
        Color.Gray;
      ch.ChartAreas[0].AxisX.MajorGrid.LineDashStyle =
        ChartDashStyle.Dash;

      ch.ChartAreas[0].AxisY.Minimum = -2;
      ch.ChartAreas[0].AxisY.Maximum = 6;
      ch.ChartAreas[0].AxisY.Interval = 0.5;
      ch.ChartAreas[0].AxisY.MajorGrid.LineColor =
        Color.Gray;
      ch.ChartAreas[0].AxisY.MajorGrid.LineDashStyle =
        ChartDashStyle.Dash;
여기부터 보도록 하겠다.
chartAreas[0]에 대한 설정들이다.
배경은 검정으로
x의 최소값은 0 최대값은 아까 세어둔 ecgCount의 값으로
간격은 50 메이저그리드의 색은 그레이로 해준다.(메이저 그리드는 말 그대로 메인이 되는 격자임 차트 뒤의 모눈종이같은거)
dashstyle은 dash로 설정해준다.
y갑은 (-2~6)까지 표현해준다. 간격은 0.5로 선의 색상과 스타일은 x선과 맞춰준다.
// Series 2개 새로 만들기
      ch.Series.Clear();
      ch.Series.Add("ECG");
      ch.Series.Add("PPG");

      ch.Series["ECG"].ChartType = SeriesChartType.Line;
      // ch.Series[0].ChartType = SeriesChartType.Line;
      ch.Series["ECG"].Color = Color.Orange;
      ch.Series["ECG"].BorderWidth = 2;
      ch.Series["ECG"].LegendText = "ECG";

      ch.Series["PPG"].ChartType = SeriesChartType.Line;
      // ch.Series[1].ChartType = SeriesChartType.Line;
      ch.Series["PPG"].Color = Color.LightGreen;
      ch.Series["PPG"].BorderWidth = 2;
      ch.Series["PPG"].LegendText = "PPG";
다음은 기존의 series를 제거하고 새거로 두 개 만들어주었다. 그리고 설정해줍니다.
ECG시리즈의 charttype은 line으로 색은 오렌지로 굵기는 2 범례는 "ECG"로 설정해준다.
PPG시리즈도 범례를 제외하곤 동일하게 설정해줍니다.
foreach(var v in ecg)
      {
        ch.Series["ECG"].Points.Add(v);
      }
      foreach (var v in ppg)
      {
        ch.Series["PPG"].Points.Add(v);
      }
ecg의 모든 아이템 v에 대한 foreach문을 돌려 ECG시리즈에 전부 AddPoint해줍니다.
ppg도 마찬가지로 해줍니다.
// 커서 사용 가능
      ch.ChartAreas[0].CursorX.IsUserEnabled = true;
      // zoom 범위 선택 가능
      ch.ChartAreas[0].CursorX.IsUserSelectionEnabled
        = true;
그리고 처음의 이 부분은 area의 cursor을 유저가 컨트롤 가능하게 만들고
유저가 범위를 선택 가능하게 만드는 것이다.
int cursorX = 0;  // 디스플레이되는 데이터의 시작점
    bool scrolling = false; // true 일 때 스크롤

    private int dataCount = 500;

    private void T_Tick(object sender, EventArgs e)
    {
      // 한 화면에 500개의 데이터를 보여줄 예정
      if (cursorX + dataCount < ecgCount)
        ch.ChartAreas[0].AxisX.ScaleView.Zoom(
          cursorX, cursorX + dataCount);
      else
        t.Stop();
      cursorX += 2;
    }
int형 cursorX를 0으로
bool scrolling = false로 선언해준다. datacount를 500으로 설정한다.
그 후 T-Tick함수를 설정 해주는데 if문 안쪽의 내용은
보여줄내용의 시작점 +500 <끝점 이면 시작점 ,시작점 +500을 zoom해주어 보여준다.
시작점 +500이 끝값과 같거나 크면 타이머를 멈춰 함수를 중지한다.
그리고 매 Tick마다 2씩 증가시켜 1밀리초에 2씩 증가하는 차트를 보여주려 한다.
private void autoScrollToolStripMenuItem_Click(object sender, EventArgs e)
    {
      t.Start();
      scrolling = true;
    }

    private void viewAllToolStripMenuItem_Click(object sender, EventArgs e)
    {
      ch.ChartAreas[0].AxisX.ScaleView.Zoom(0, ecgCount);
      t.Stop();
      scrolling = false;
    }

    private void exitToolStripMenuItem_Click(object sender, EventArgs e)
    {
      this.Close();
    }
디자인 탭에서 추가 해주었던 menu의 3가지 탭에대한 함수의 내용이다.
autoscroll메뉴를 클릭하게 되면 타이머 t를 시작해주고 scrolling을 true로 해준다.
viewall을 클릭하게 되면 차트를 다시 처음부터 끝까지 전체적으로 보여주게 되고 타이머를 멈춘 뒤 scrolling를 false로 해준다.
exit메뉴를 고르게 되면 this.close한다.
bool isTimerRunning = true;


    private void ch_Click(object sender, EventArgs e)
    {
      if(isTimerRunning)
      {
        t.Stop();
        isTimerRunning = false;
      }
      else
      {
        t.Start();
        isTimerRunning = true;
      }
    }
차트를 클릭했을 때의 이벤트함수를 만들어주었다.
bool type istimerrunning을 선언해준 뒤
ch_click 안에 내용은
timerrunning이 true일 시(default가 true임)
타이머를 멈추고 false로 바꿔준다.
false라면 타이머를 시작하고 timerrunning을 true로 해준다.
private void ch_MouseClick(object sender, MouseEventArgs e)
    {
      HitTestResult htr = ch.HitTest(e.X, e.Y);
      if(htr.ChartElementType == ChartElementType.DataPoint)
      {
        t.Stop();
        string s = string.Format(
          "Count: {0}, ECG: {1}, PPG:{2}",
          htr.PointIndex,
          ch.Series["ECG"].Points[htr.PointIndex].YValues[0],
          ch.Series["PPG"].Points[htr.PointIndex].YValues[0]);
        MessageBox.Show(s);
      }
    }
차트 클릭 시의 함수이다.
Hitresult 클래스의 htr을 선언해준 뒤 차트ch의 e.X, e.Y값을 가져온다.
그리고
//이 부분은 좀 더 공부하고 추가하겠다.
private void dataCountToolStripMenuItem_Click(object sender, EventArgs e)
    {
      dataCount = dataCount*2;
    }

    private void dataCountToolStripMenuItem1_Click(object sender, EventArgs e)
    {
      dataCount = dataCount / 2;
    }
menu의 아이템인 autoscrollview 안에 Datacount++ 와 Datacount-- item을 두 개 추가해주었다.
이 아이템[0]과 아이템[1]에 대한 클릭이벤트리스너이다.
Datacount++을 누르면 datacount의 값을 두 배로하여 위의 Tick이벤트시 차트가 더 넓게 보일 수 있도록 해 준다.
반면에
Datacount--버튼을 누르면 Datacount의 값을 1/2로 하여 Tick이벤트시 차트가 더 좁게 보이도록 한다.
감사합니다.
'VS-02분반수업' 카테고리의 다른 글
| VP(22-06-03) (0) | 2022.06.08 |
|---|---|
| VP(22-06-02) (0) | 2022.06.08 |
| VP(22-05-25) (0) | 2022.05.25 |
| VP(22-05-20) (0) | 2022.05.24 |
| VP02(22-05-13) (0) | 2022.05.17 |